A double dose of infographics for Elsevier on the UN’s Sustainable Development Goals
Providing the client with a number of design options
Having been given two briefs covering different aspects of research and analytics in the SDG space, we helped craft the briefs and approach we would take with Elsevier. The purpose of the infographics was to be a valuable guide for universities and academics about the global growth stats of countries that excelled in efforts to perform in the SDG’s research sector. Who was performing well in pushing forward? Who was not? What did this tell us about priorities and the overall engagement health of the UN’s SDG’s?
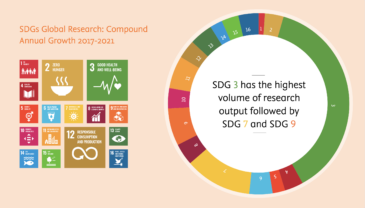
Our approach was to break the content down into 4 sections of the different areas of research being covered and use a single word to capture the essence of each quarter. The four words – Inspiration, Relevance, Quality and Collaboration – were used around an overarching pie that showed the global growth of SDG research. This set the main structure for future templates that would be used for other sector and subject-specific research.
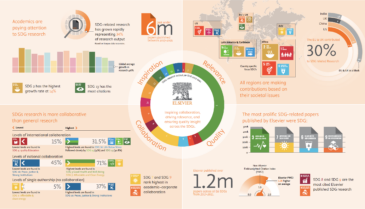
For the four quarters, we created a series of infographics and illustrations to capture the key data findings but looked at ways these could also be used or adapted in the master template for future iterations of data and insight. Data on its own can be cold and disengaging and since Elsevier’s target market is not only fellow researchers but also governments, academics and universities this minimalistic approach of core insights seemed like the perfect way to engage these audiences so that they’d be interested to delve deeper into the full reports and their findings.
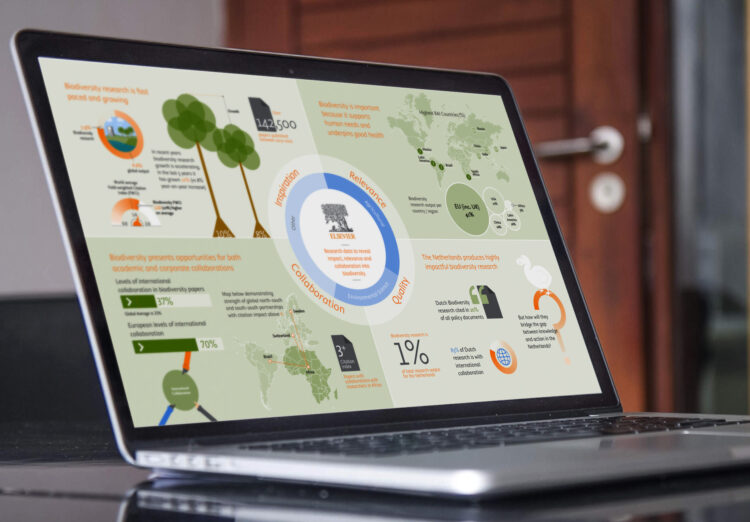
Understanding biodiversity through the lens of the UN’s Sustainable Development Goals
Having created the first master template with actual content, the next task was to adapt this for a subject-specific research infographic and this was for Biodiversity collaborations.
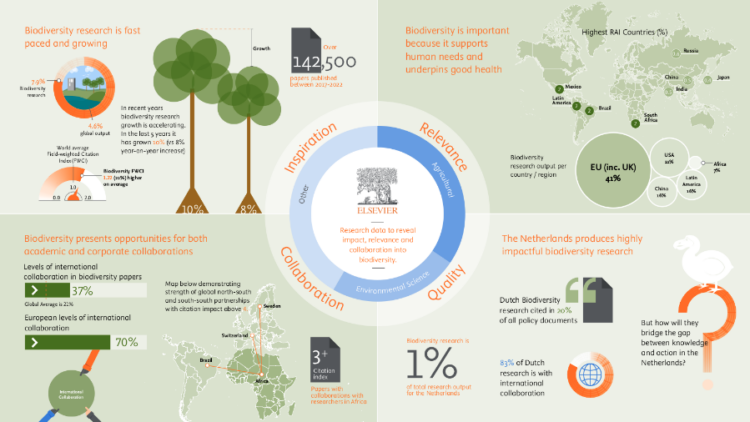
It was interesting to see that some countries with the lowest number of publications had among the highest collaborations and those with the highest volume of publications often weren’t great at collaboration. Beyond this was whether the quality of research and collaborations had an impact on action, not always the case as can be seen from the Netherlands. To help convey this at a top level before delving into the ‘data detail’ we differentiated the infographics with a colour theme based on a softer, more friendly look, depicting scenes of nature, animals, and the main stats to engage interest. The graphics are again relevant to the stories and insight from the data, from maps to depict country-by-country data, trees to depict the wider biodiversity themes, to elements of humour to address the need for greater action.
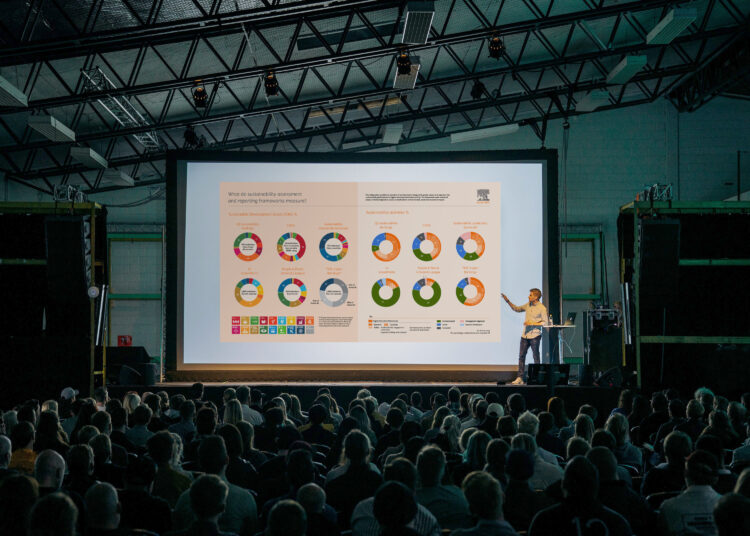
Comparing data from the UN SDGs and sustainability activities
We don’t just create infographics, we try to understand the data and create something that can convey complex messages in a simple and engaging format. Whilst working on the above challenge, one of the teams working on the data for the above project really liked our approach to infographics and simplifying the complex. They gave us the brief they had been given to develop infographics for a complex and varied set of data from two different metrics of SDG data and sustainability activities.
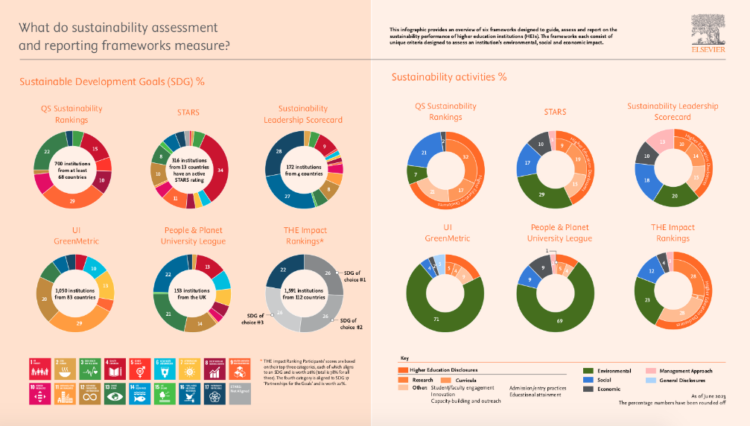
We discussed with the client team what the multiple sets of complex data meant and what the key takeaways should be, distilling it down to its most basic form and through this, we were able to present the two sets of data with clarity and consistency. Often we will sketch quick ideas to show the approaches we could take before spending too much time on colour, typography and graphics on the computer which may be going in the wrong direction. Some clients like this, others need more highly polished visuals – the latter obviously taking longer but we are happy to work both ways.
For the final solution, we settled on using simple doughnut pie charts to link the two sets of data and separated them visually by using the UN SDGs colour scheme on the left side, and a colour palette based on naturally associated colours with their topics for the other sustainability data on the right. The end result is a detailed dual-infographic that easily allows you to quickly compare complex data and see where the big differences are across the six areas covered by the research and the report.